
Facilitate
Monitor running Sessions, act on stuck work, and triage support threads.
The Facilitate view shows a published Map with live Session data: which Sessions sit at which stage, who is assigned, and which Sessions need attention. Use it to monitor running work, act on stuck Sessions, and triage support requests.
Switching Modes
Every published Map has three modes, accessible via a segmented toggle in the top bar:
| Mode | Purpose |
|---|---|
| Build | Design stages, transitions, Map Roles, and blocks |
| Facilitate | Monitor live Sessions, act on individual Sessions, triage support threads |
| Analyze | Understand historical patterns — bottlenecks, durations, workload trends |
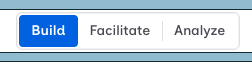
Click Facilitate in the toggle to enter the facilitation view. Facilitate and Analyze are available only on published Maps.
When you switch between modes, your camera position (zoom and pan) is preserved — the transition feels like switching a lens on the same Map rather than navigating to a separate page.
The Facilitate Graph
The Facilitate graph displays the same Map as the Builder, but in read-only mode with runtime annotations. You cannot edit stages or transitions here — switch back to Build for that.
Each stage node shows:
- Support thread badge — A chat icon in the top-left corner on stages with active support threads. An unread indicator appears when new messages are waiting. Click the badge to navigate to the thread in the Support panel.
- Role icons — Badges showing which Map Roles are assigned to the stage
When a Session is selected, nodes also show assignee avatars — a row of small avatars below the node showing who is assigned at that stage (up to 10 visible, with a "+N" overflow when there are more). See Selecting a Session.
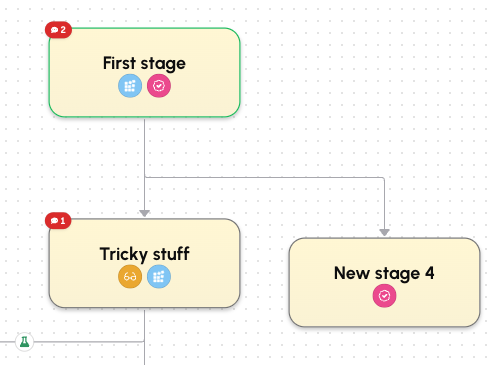
The graph answers "where is work?" at a glance. Your eye is drawn to stages with unread support threads.
The Side Panel
The side panel is always visible on the right. A toolbar at the top lets you switch between two tabs.
Sessions
The Sessions tab shows all Sessions for this Map in a sortable, searchable list.
| Column | What it shows |
|---|---|
| Support | A thread icon on Sessions with support threads (red when unread) |
| Assignees | Who is assigned to the Session's current stage |
| Status | Active, completed, or stale (active for more than 14 days) |
| Started | When the Session began (relative time) |
| Stage | Which stage the Session is currently at |
| Idle | How long the Session has been at its current stage |
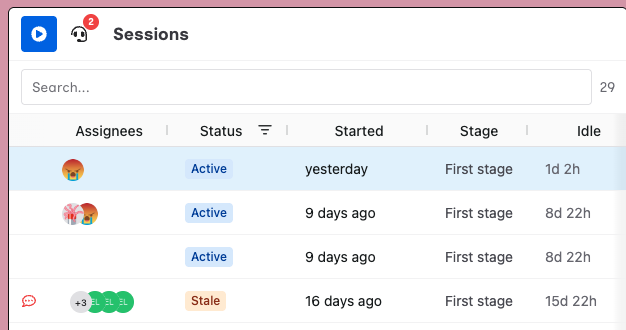
Click a Session row to select it — the graph updates to show that Session's path through the Map. See Selecting a Session below.
Support
The Support tab is a triage view of support threads across all Sessions on this Map. The header bar includes search, an unread-only toggle, and a thread count.
Each thread card shows:
- Session name and current stage
- Latest comment preview
- Optional unread indicator
- Resolved or open status
- Link to open the Session
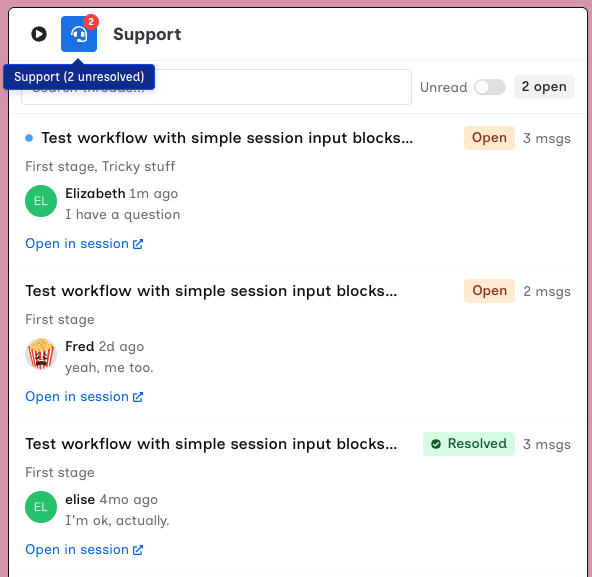
Inline conversation: When you select a Session (either from the Sessions tab or by clicking a thread card), the Support tab switches from the thread list to a full conversation view. You see the complete message history, a composer for replies, and a resolve/reopen button. Messages update in real time — new replies appear without refresh. A visibility notice reminds you that conversations are visible to all participants and Map admins.
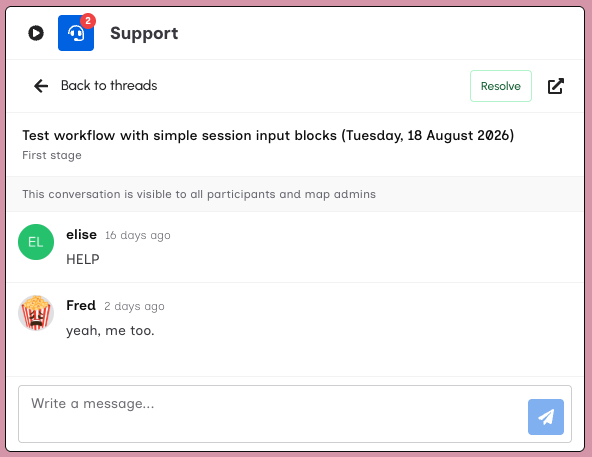
Clicking a thread card also selects the corresponding Session, so both tabs stay in sync.
Selecting a Session
Session selection is the primary interaction in the Facilitate view. Select a Session by clicking its row in the Sessions tab or by clicking a support thread card.
| State | Graph | Side panel |
|---|---|---|
| No Session selected | All nodes show runtime annotations (assignee avatars, support badges) | Sessions tab shows the full list; Support tab shows all threads |
| Session selected | Completed stages get checkmarks, the active stage gets a green border, pending stages are dimmed | Sessions tab highlights the selected row; Support tab shows that Session's conversation |
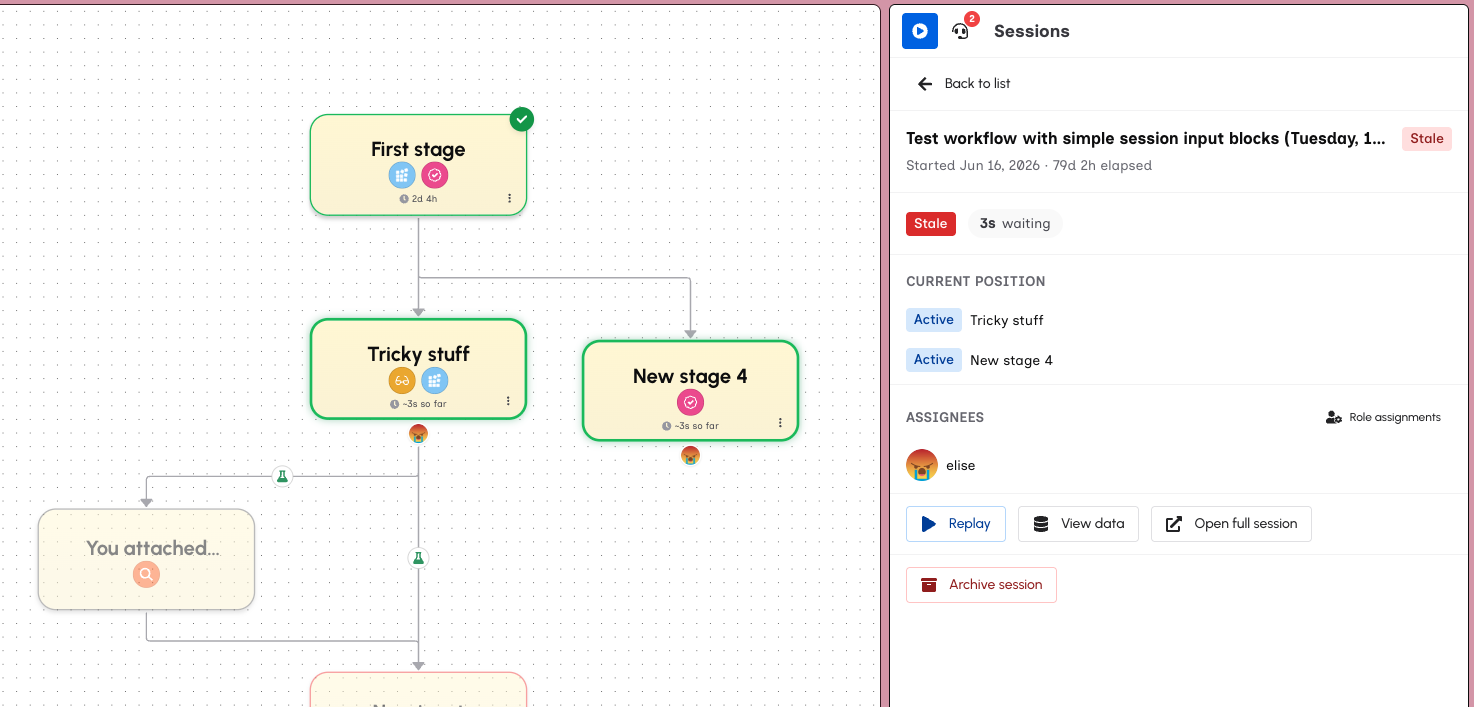
When a Session is selected, each stage node also gains a three-dot menu with stage-level admin actions — see Stage Actions below.
Stage Actions
When a Session is selected, each graph node shows a three-dot menu (⋮) with admin actions for that stage in the context of the selected Session. These are the same facilitation actions available from the session admin menu, accessed directly from the Map graph.
| Action | When available | What it does |
|---|---|---|
| Rewind | Stage is active and is not the starting stage | Deactivate the current stage and reactivate its predecessor |
| Reopen Stage | Stage is completed | Reactivate a completed stage for further editing without affecting later stages |
| Mark Complete | Stage is active | Force-complete the stage as an admin, triggering progression |
| Nudge | Stage is active and has assignees | Send a reminder to assignees with an optional message |
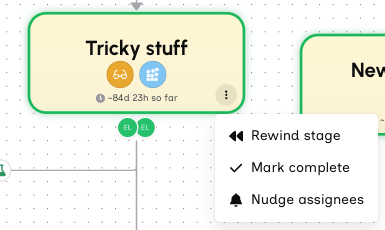
Rewind, Reopen Stage, and Mark Complete show a confirmation dialog before executing. Nudge opens a dialog where you can select which assignees to notify and write an optional message.
For full descriptions of each action and when to use them, see Managing Sessions.
Session Actions
The Facilitate view also provides session-level actions when a Session is selected. These apply to the Session as a whole, not to an individual stage.
| Action | When available | What it does |
|---|---|---|
| Assign Roles | Any time | Open the role assignment dialog to add or remove participants from Map Roles for this Session |
| Reopen Session | Session is completed (workspace owner/admin/builder only) | Clear the completion status so participants can resume where they left off |
| Archive | Workspace owner/admin/builder only | Hide the Session from the default list (data is preserved) |
For full descriptions, see Session actions.
Session Replay
When viewing a selected Session, you can step through its execution history event by event. Replay reconstructs the Session's timeline from stage activations, assignments, completions, and data entries — it is not a screen recording.
The replay controls appear at the bottom of the graph:
- Play/Pause — Automatically advance through events
- Step forward/backward — Move one event at a time
- Scrubber — Drag the timeline to jump to any point; event dot markers show where things happened
- Elapsed/Total time — Current position and total Session duration
- Exit — Click the X to leave replay mode
During replay, the graph updates to show the Session's state at each moment:
| Stage state | Visual |
|---|---|
| Pending | Dimmed (not yet reached) |
| Active | Green border |
| Completed | Green checkmark |
Edges briefly pulse when a transition fires. Assignee avatars on nodes reflect who was assigned at that point in replay time, not who is assigned now.
When a participant entered data during the Session, a transient label appears above the relevant node (e.g. "✏️ Sarah → Feedback"). Grouped writes within the same second collapse into a count ("✏️ Sarah → 3 fields"). These flashes hold briefly then fade, and are suppressed during rapid scrubbing.
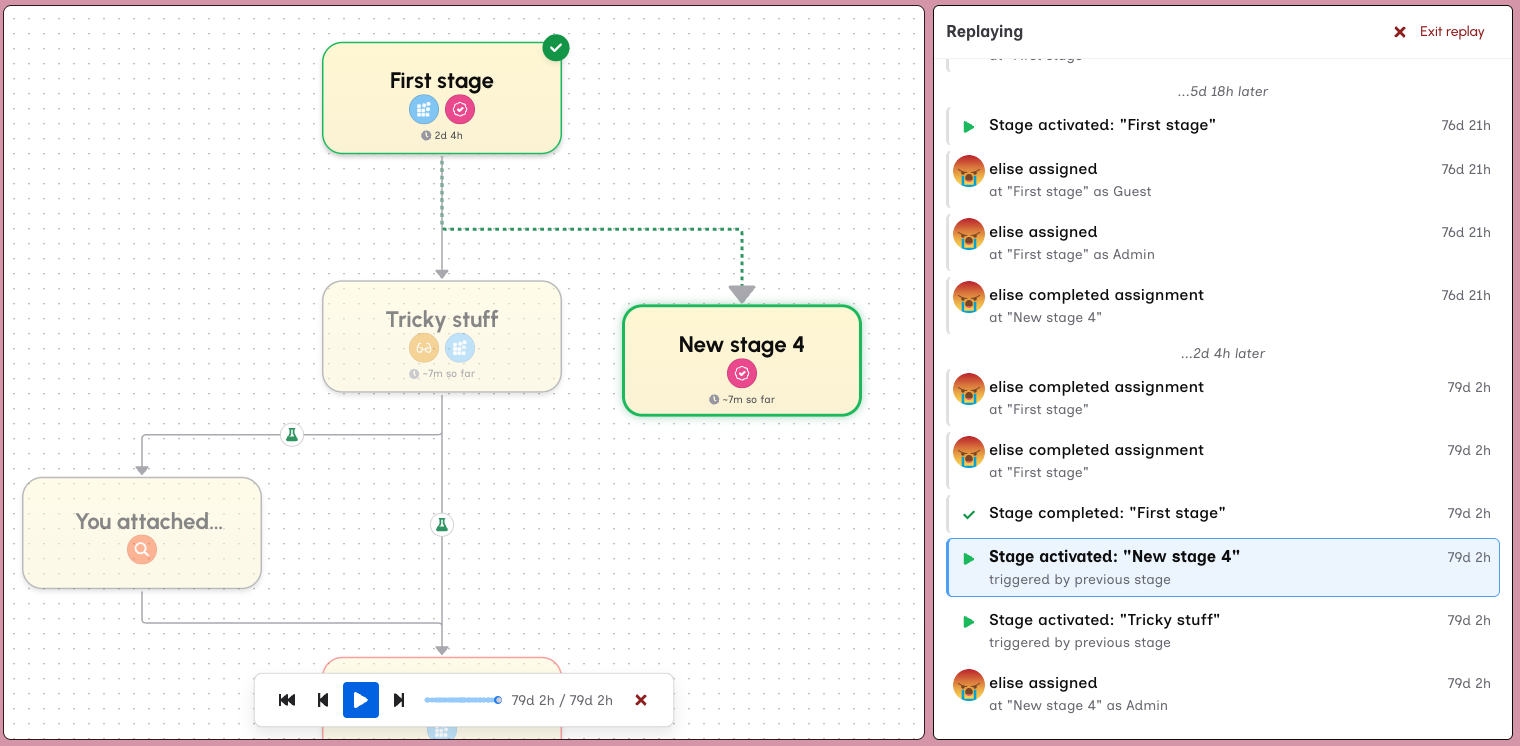
The side panel switches to an event log — a chronological list of everything that happened during the Session: stage activations, assignments, completions, and data entries. The current scrubber position is highlighted and auto-scrolled into view. Click any event in the log to jump to that moment.
Longer real-time gaps are compressed so a multi-day Session plays through in minutes. A label fades in during longer pauses ("...47 hours later...") so you stay oriented in the timeline.
See also: Designing Maps in Maps, the participant experience in Sessions, or historical performance in Analyze.